Carta’s Founder Ownership Report 2026 tracks median founding team equity from 82.5% at pre-seed to 10.4% at Series D. The dilution curve is the visible story. The structural questions each stage activates are the useful one, especially for MENA companies, where the chart’s silent assumptions become the first diligence questions.
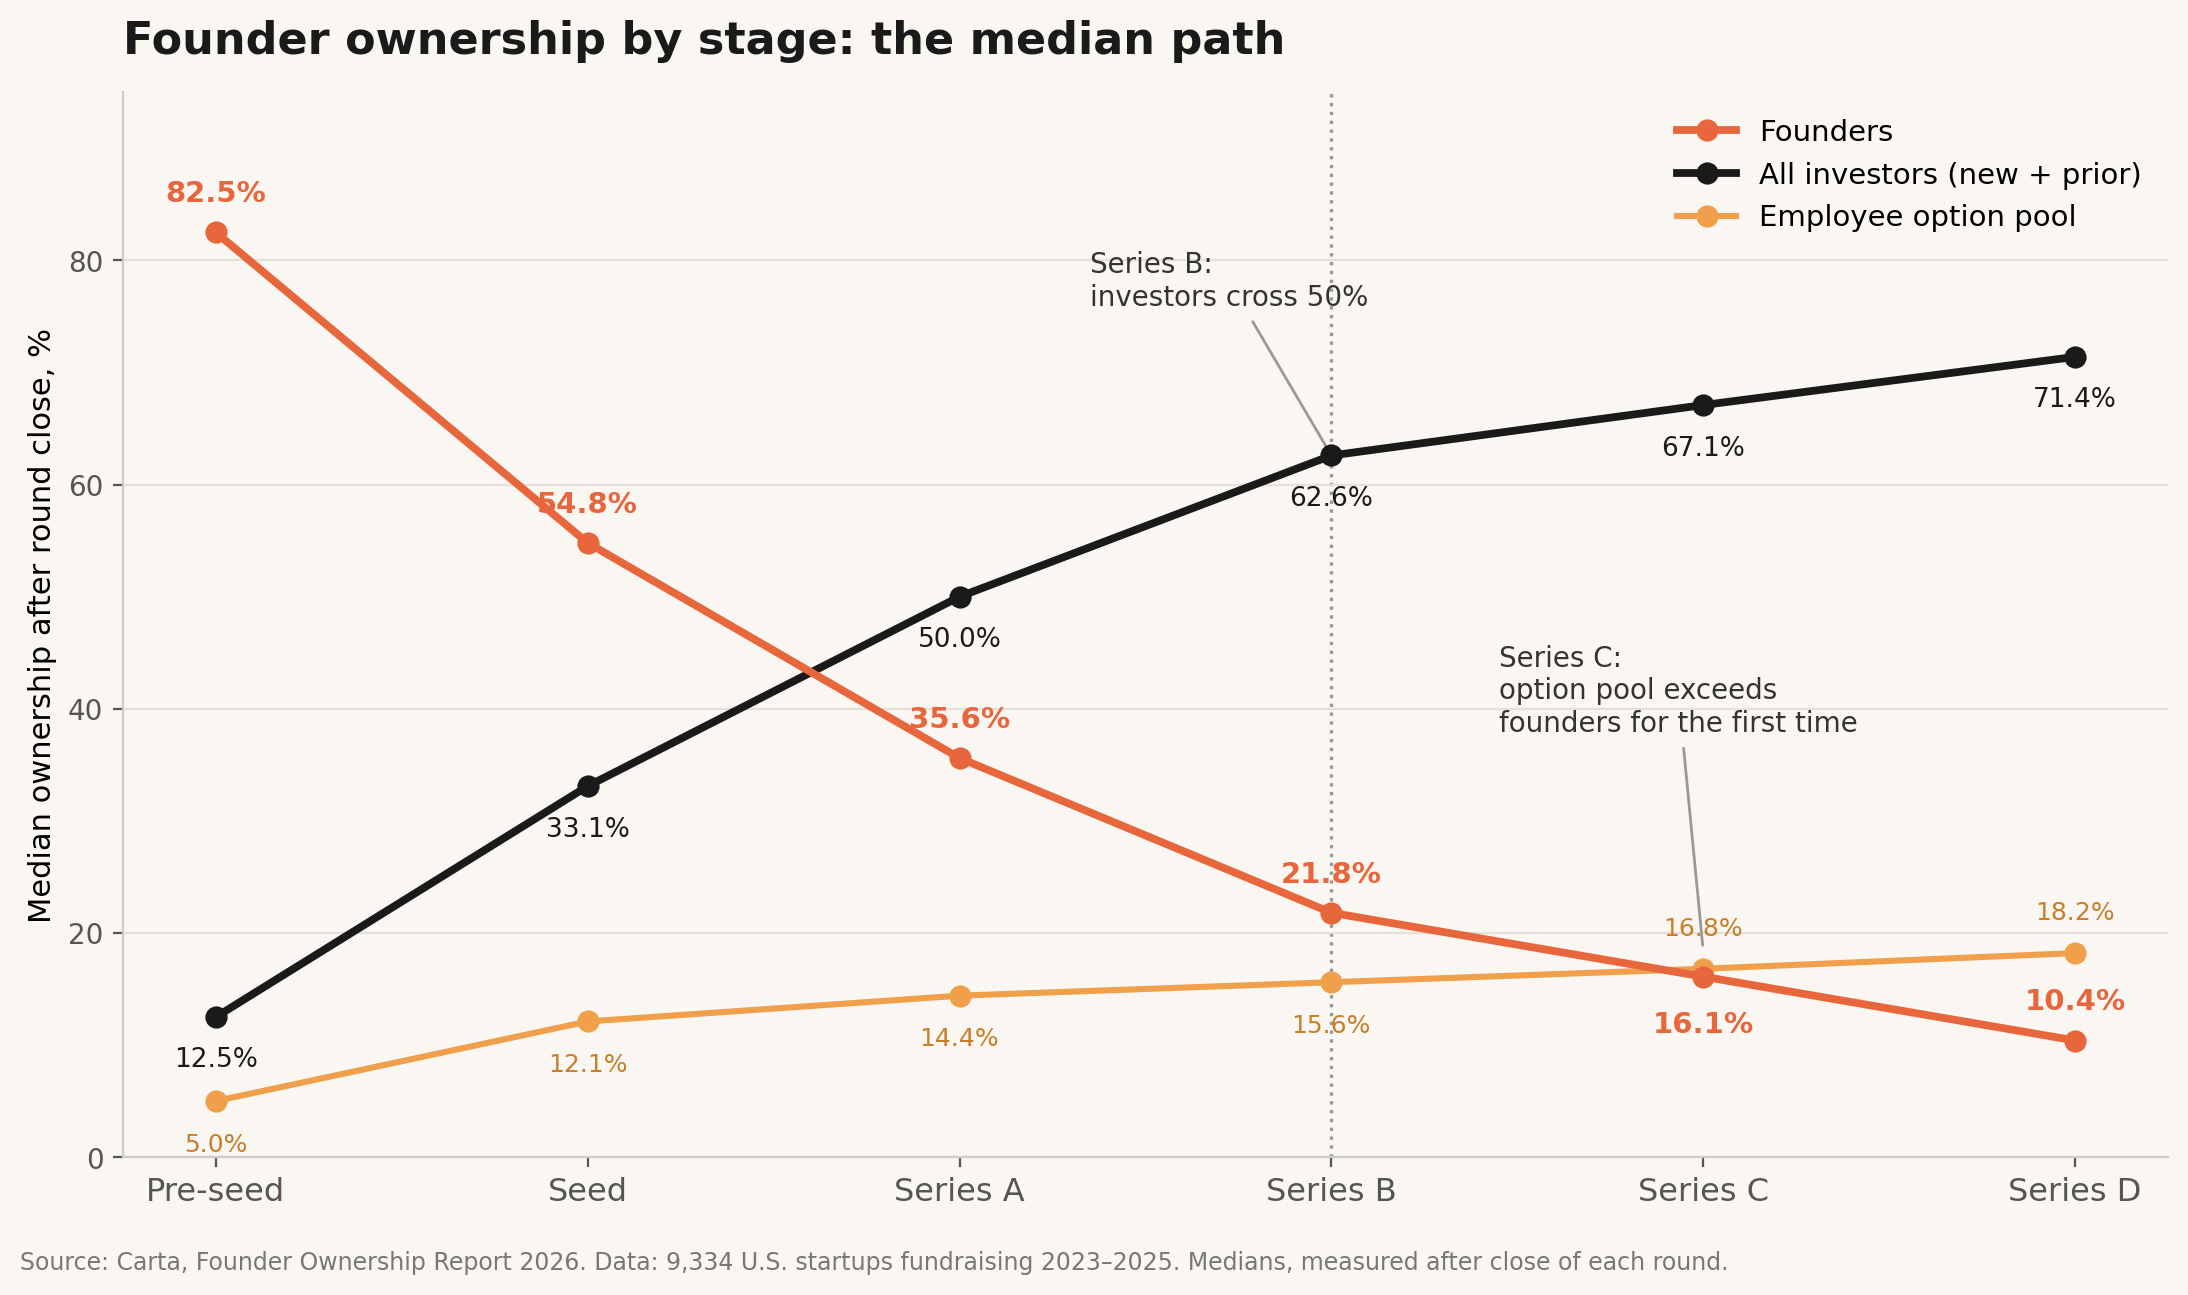
Carta published its Founder Ownership Report 2026 in March. The headline ownership-by-stage chart draws on 9,334 US startups that raised capital between 2023 and 2025, with medians measured after the close of each round: founding teams collectively hold 82.5% at pre-seed, 54.8% after seed, 35.6% after Series A, 21.8% after Series B, 16.1% after Series C, and 10.4% after Series D. Investors, combined, end that path at 71.4%.
The common reading of this data is a dilution story: look how much founders give up. That reading is accurate but incomplete. Dilution is the price of venture capital, every founder who raises knows it in the abstract, and no chart changes the decision to raise.
The useful reading is different. Each stage on that curve is the point where a specific structural question stops being theoretical and starts being priced. The chart is not a warning about dilution. It is a schedule of when each part of your structure gets tested.
After seed: one round away from losing the majority
The number that deserves more attention than it gets is 54.8%. That is the median founding team position after seed: still a majority, but a thin one. One more round at typical terms and the team is below half.
The practical consequence: “we will clean up the structure before the big round” is a plan that arrives late by definition. The structure that governs your Series A negotiation is the one you built at seed. The SAFE terms, the founder vesting, the jurisdiction of the holding entity, the way the ESOP was promised: all of that is already signed by the time the round where it matters begins.
Investor-grade structure is not a Series A deliverable. It is a precondition for the first serious money, because the first serious money is what converts every earlier improvisation into a binding term.
Series A: 50% ownership is not 50% control
At Series A, the Carta median splits almost exactly in half: the founding team plus the employee pool hold 50%, all investors hold the other 50%. The symmetry is visually satisfying and analytically misleading.
Economic ownership answers one question: who gets what share of proceeds. It does not answer who decides. Control lives elsewhere: in board composition, in reserved matters, in voting thresholds, in protective provisions, in share classes with differentiated rights. A founding team holding 50.1% of the economics can be operationally subordinate to a 20% investor whose consent is required for hiring above a threshold, taking on debt, or approving next year’s budget.
This is the stage where the two ledgers, the ownership column and the control column, permanently diverge. From Series A onward, reading a cap table without reading the shareholders’ agreement next to it tells you who profits, not who governs.
The pre-seed footnote that moves the whole chart
Carta flags that pre-seed positions are typically held through SAFEs that have not yet converted. The 12.5% shown for pre-seed investors is expected ownership after conversion, not issued shares.
This footnote matters more than its placement suggests. A cap table that shows only issued shares is systematically flattering to founders. Every outstanding SAFE and convertible note is future dilution that has already been sold but not yet displayed. The instrument that makes early fundraising fast is the same instrument that makes early cap tables misleading.
The version of the cap table that investors underwrite is fully diluted: every SAFE modeled to conversion, every note with its discount and cap applied, every promised option counted whether granted or not. If the fully diluted view and the issued view have never been reconciled, the reconciliation happens during diligence, on the investor’s model, at the founder’s expense.
Series B: the file becomes as important as the structure
By Series B, prior investors (not the new money, the accumulated earlier rounds) hold 46.1% at the median. Combined investor ownership crosses 50% for the first time. The median venture-backed company is majority investor-owned before most of them reach meaningful scale.
By this point in the cap table’s history, a new investor is no longer just underwriting the company. They are underwriting the record: every issuance, every transfer, every conversion, every board approval that authorized them. A share position is only as good as the sequence of documents that produced it. One undocumented transfer at seed, one option grant that skipped board approval, one SAFE amendment agreed by email and never signed. Each is a defect that now touches a majority of the cap table, because a majority of the cap table now sits downstream of it.
This is why later-stage diligence feels disproportionate to founders. It is not that the questions got harder. It is that every early shortcut now has more shareholders standing on top of it.
Series C: the option pool passes the founding team
At Series C, the Carta medians cross: the employee pool reaches 16.8% while the founding team’s aggregate stake is 16.1%. The pool created to hire the team is now larger than the combined position of the founders. Carta calls this crossover out explicitly in the report.
The structural implication is that employee equity stops being an HR topic and becomes a material diligence workstream in its own right. Investors examine the plan documents, the remaining reserve, outstanding grants, vesting schedules, leaver treatment, and the approvals supporting each issuance: whether each grant was authorized by the board or merely promised by a founder, and whether the plan’s paperwork matches what employees believe they hold.
In markets where phantom equity substitutes for real options, a recurring pattern in structures I review across MENA, this examination has a sharper edge, which is where the US data stops describing the region.
Series D: early mistakes at their most expensive
By Series D, the median founding team collectively retains 10.4% and investors hold 71.4% across what is typically four to five rounds of preferred stock. Any defect from the early years (the unsigned amendment, the mispriced grant, the transfer that skipped a right of first refusal) now requires consents and corrections across dozens of holders with divergent interests.
The cost curve of structural mistakes is not linear. A problem that one email would have fixed at seed requires a shareholder resolution at Series B and a negotiation at Series D. The mistake did not get worse. The number of people with standing to price it did.
What the chart still does not show: economics
Everything above concerns ownership. Ownership is not exit economics.
The 10.4% a founding team holds at Series D sits underneath the full stack of liquidation preferences accumulated across every round. At exit, preferred holders receive proceeds ahead of common shareholders according to the agreed seniority: senior, pari passu, or tiered, depending on the documents. Only then does common see anything. Two companies can show identical founding team percentages and produce entirely different outcomes at the same sale price, depending on whether the stack is clean 1x non-participating throughout or carries a 2x from a down round and participating preferred from a bridge.
The Carta chart tracks the visible cost of venture capital. The preference stack is the invisible one. Founders monitor the first on every term sheet and almost never model the second until the waterfall runs. At that point it is arithmetic, not negotiation.
The MENA layer: where the chart’s assumptions become questions
The Carta chart compresses ownership into the cap table of a defined issuer. It does not show whether the operating business, the IP, the employees, and the cash sit in that same entity. For most US companies that gap is small. In a multi-jurisdictional MENA structure, that omission can become the first diligence question.
The structures I see reaching institutional rounds from this region regularly involve a mainland or free-zone operating company, an ADGM or DIFC holding entity added later, founder shares held personally across jurisdictions, and early investment instruments signed with whichever entity existed at the time. Before any of the stage-by-stage questions above can be answered, a prior one has to be: in which entity, under which law, do these percentages actually exist.
Three region-specific gaps recur in practice.
First, the ESOP shown on a cap table is often phantom: a contractual bonus formula, not enforceable options. Sometimes that is because the operating jurisdiction does not support real option issuance, sometimes simply because phantom was cheaper to set up. The Series C lesson above lands differently when the 16.8% “pool” is, on inspection, a discretionary liability rather than equity.
Second, instruments and entities drift apart. A SAFE issued by an operating company does not automatically become convertible into shares of a later-created holding company. The restructuring has to address assignment, novation, or amendment under the applicable documents and law, and until it does, the fully diluted cap table question from pre-seed is unanswerable. Amending instruments after the fact requires investor consent, and consent at that point has a price.
Third, the record that Series B diligence underwrites is often split across jurisdictions with different formalities: notarization requirements, regulator approvals for transfers, attestation chains. A history that is complete by the standards of one jurisdiction can be defective by the standards of the one where the investor’s rights need to be enforceable.
Carta does not establish equivalent MENA medians, and nothing in the US data should be read as one. What the report illustrates is the underlying mechanism: dilution compounding round over round, and structural questions becoming more expensive as the cap table grows. The regional work is building a structure that can absorb that mechanism cleanly: a consolidated holding entity, instruments that specify what converts into what, an option plan that is legally real, a record that survives cross-jurisdictional review. That work has to precede the curve, because every stage on it prices structural uncertainty before it prices anything else.
Investors do not only price growth. They price uncertainty. The Carta chart shows how much equity the median founding team trades for capital. What it cannot show is how much of the remainder survives contact with the structure underneath it.
Source: Carta, Founder Ownership Report 2026. The ownership-by-stage chart draws on 9,334 U.S. startups fundraising in 2023–2025; medians measured after close of each round.